
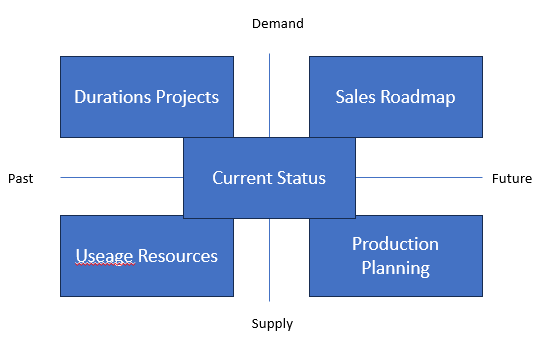
To steer any operational process, management needs at least five reports. Below a description of these five, which apply to it seems every industry (Please let me know if an industry has been overlooked!). The order is indicative of their importance, but do not be fooled: the lowest order reports (‘history’) are needed to verify the higher order reports (‘future’).
- Current status
Of course, any business needs to have an indication of where the business stands. The KanBan Board showing which sales/products/services (‘demand’) are in which stage of development is probably one of the most popular reports. The expected benefit (‘Impact’/’value points’) of features is weighed against the cost (‘story points’/’T-shirt sizes’ /working hours’ ) and decisions are made on where to spend your valuable time. Little to add except that this report has very little predictive value by itself. For predicting the future, the following two Roadmaps are being used.
2. Sales Roadmap (based on calendar days, time)
The future of this demand is crucial for communication with clients and to drive the internal production. When does the next version of the game come out? Will we be able to present it at the next trade show, and when will the marketing materials need to be ready? What deadlines do we give to internal production?
3. Production Planning (based on working hours, effort)
A complementary report shows the planning of resources over the next periods (and on which features). Because somebody needs to do all the programing of those new releases. Here the first sanity checking can be done by verifying of the workload for the team really is realistic. Whether this planning is done in story points, T-shirt sizes or working hours does not matter, whichever measurement makes sense. (My private expectation is that ultimately you always end up in working hours, because these allow for comparison of workloads among jobs, can be planned and re-planned, can be used for verification of workload estimation afterwards – and usually will need to get paid.)
4. Product History (based on calendar days, time)
Now the commercial departments have a reputation of underestimating the time needed to fulfill their customers’ needs. (And overestimating the impact of these features on sales but that is a different chapter.) Now how realistic was the estimate of effort needed to produce the new release and how many times will the scope need to be extended?:
5. Resources History (based on working hours, effort)
And finally, the often overlooked basis of it all is an overview and resulting analysis based on the productivity of workers: what was the productivity of your individual(s/teams) on the various activities, how many hours were used to generate the effort needed? And how does reality differ from expectation, and what was the explanation for this difference? If last month we took x minutes per line item, what is the reason that we expect to spend 10% less the coming period?
Table 1. The four wind directions of operational reporting
Exchange currency
Impact or value points can be the measurement unit for demand, however, it would be advisable to translate them into market share or sales or something tangible to avoid ‘discussions of thin air’. The explanation is probably easiest when discussing the same mechanism for resources: one can translate story points or T-shirt sizes to working hours if the operation is internally. Any planning of internal people will ultimately boil down to number of working hours in a period, vacation and illnes time. (Similar for machines or land, with maintenance and repair.) In case one obtains external support where payments and plannings are made on the basis of other ‘exchange units’ – like e.g. story points – then formally it does not make sense. But believe me, you do want to keep track of a rough working hour indication of the people involved. The most frequent pitfall I encountered was some bean counter just calculating how many FTE would theoretically be needed, forgetting that an ever higher workload for a team will mean either a chance of burn-out (surprisingly, there is a limit to overtime) or an increase of the team with inexperienced/new programmers. Please keep in mind that not only will fresh inflow usually significantly decrease overall speed, but their training will use some of your best workers as well, making their candle burn on both ends.
Using the reports
The Current status plus both Roadmaps usually are used on a regular basis to decide on where to spend our resources and howe to communicate these expectations. Product History is the deep dive of Commerce whereas Resources History the same of Operations. However, a good general manager will once in a while conduct a ‘deep-dive’ into these reports. And that can be done fairly easily: you just take two consecutive reports and ask the differences explained. Then, depending upon the listening skills of the manager, in no time a picture of the status ‘below the surface’ and to what extent the operation is under control can become clear.
